Biophysical characterisation of V434L variant
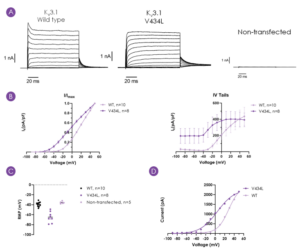
Whole-cell manual patch clamp experiments were performed on CHO-K1 cells transiently transfected with WT or V434L KCNC1 (Figure 2). Biophysical data of the WT and variant channels was consistent with published results1, with a clear leftward shift in the voltage dependence of activation (Figure 2B) confirming V434L as a gain-of-function mutation.

Figure 2: Representative current traces (manual patch clamp) for WT and V434L-variant KV3.1 channels, and non-transfected CHO-K1 cells (A), current density plots of voltage-dependent activation and tail currents, mean ± SEM (B), comparison of resting membrane potential (C). Example IV plots from Qube automated patch clamp recordings performed using same voltage protocol shown for comparison (D).
Pharmacological validation of KCNC1 WT and V434L variant
Two known KV3.1 channel modulators, 4-aminopyridine (4-AP; Sigma Aldrich) and AUT1 (Cayman Chemicals), were selected for the initial pharmacological validation of WT and V434L KV3.1 transiently expressed in CHO-K1 cells using whole-cell patch clamp technique (Figure 3).
The pharmacological data revealed clear differences between WT and the V434L KV3.1 variants, with 3 mM 4-AP almost fully inhibiting WT KV3.1 at +40 mV, but only partially inhibiting the V434L variant. For AUT1, there was inhibition of the current in V434L at +40 mV, but an increase in current amplitude evoked under the same conditions in the WT KV3.1.

Figure 3: Concentration-response data for 4-AP (A) and AUT1 (B) in WT and V434L KV3.1 variants (mean ± SEM).
Development of clonal cell line
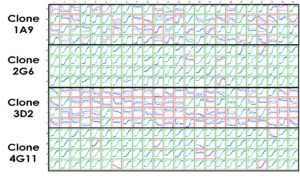
Initial assessment of the polyclonal V434L KV3.1 cell population in single hole QChips on the Qube indicated a low percentage (~5%) of cells expressing >400 pA current at +40 mV. 384 distinct cell populations derived by dilution cloning of the polyclonal cell line were subsequently tested in the thallium flux assay on the FLIPR. Ten clones were selected for further assessment in the fluorescence assay before final assessment of four clones by automated patch clamp assays on the Qube (Figure 4), which led to Clone 2G6 being selected for screening activities.

Figure 4: Assessment of four putative CHO-K1 monoclonal cell lines expressing the KV3.1 V434L variant using Qube single hole QChip. Percentage of cells achieving acceptable QC parameters (input resistance ≥ 200 MΩ and current amplitude ≥ 400 pA; highlighted with green outline) was 95.8% for clone 2G6.
Thallium flux assay validation and drug repurposing library screen
The thallium flux assay was optimised for high throughput screening and the protocol validated using mock screening plates consisting of randomly spiked wells containing two known KV3.1 modulators, AUT1 and fluoxetine (Figure 5A). For the screen, The Broad Institute Repurposing Library of 6,718 compounds was tested in duplicate at a final concentration of 10 µM. Percent inhibition in the test wells was calculated from in-plate controls consisting of 0.5% DMSO (0% inhibition) and 10 mM TEA-Cl (100% inhibition). Example data and a summary of the screening plate statistics is shown in Figure 5B and C.

Figure 5: Concentration-response data for AUT1 (IC50 = 12.1 µM) and fluoxetine (IC50 = 12.3 µM) in spiked plate test (A). Example kinetic data showing response to the addition of 1 mM Tl2SO4 and 10 mM K2SO4 in the control wells (B) and summary of plate statistics for the 46 screening plates (C), robust Z’ = 0.72 ± 0.07, signal-to-background = 3.48 ± 0.42 (mean ± SD).
Hit analysis
The duplicate percent inhibition data showed good correlation between the n=1 and n=2 determinations (Figure 6). 320 compounds (4.8%) inhibited the thallium response by 50% or more, with 34 compounds (0.5%) inhibiting above 90%.

Figure 6: Correlation of duplicate percent inhibition data (A) with compounds inhibiting greater than 50% annotated with phase in drug development (B).
Using a combination of activity in the thallium flux assay and the annotations in The Broad Institute Library registry such as clinical phase and known target class, eighty compounds were subsequently selected for concentration-responding testing in the thallium flux assay. Compounds were screened as ten-point curves in duplicate with each plate also containing TEA-Cl and AUT1 concentration-response curves to verify the assay performance.

Figure 7: pIC50 values of AUT1 (purple bars) and TEA-Cl (grey) control compounds in each screening plate (A), and pIC50 values for the 80 test compounds (B). 49/80 compounds have pIC50 > 5.5, and 16/80 have pIC50 > 6.0.


