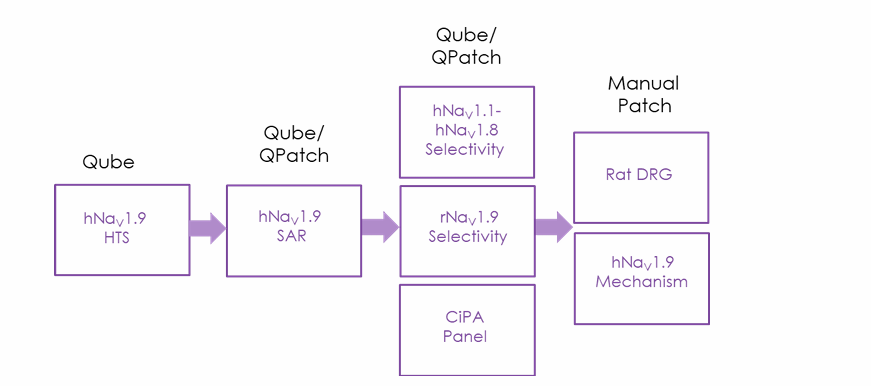
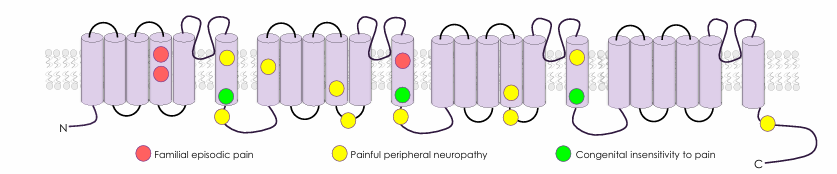
1. Biophysical assessment of hNaV1.9 using QPatch and Qube automated patch clamp
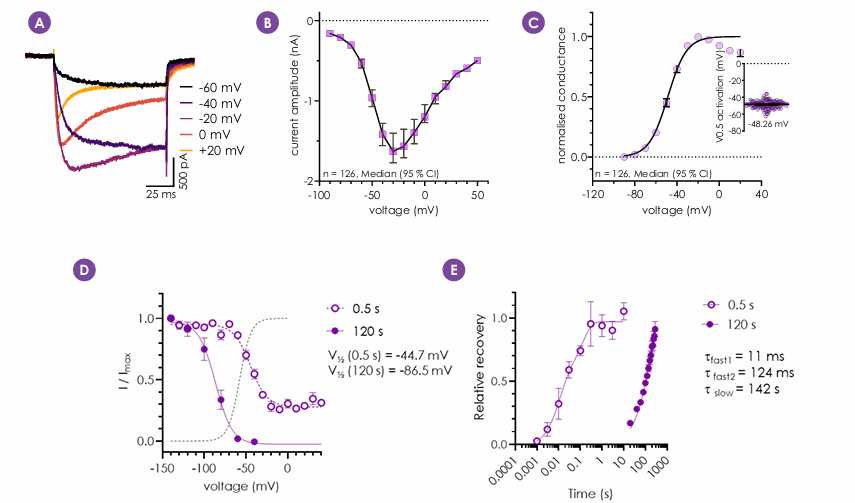
Figure 2 - hNaV1.9 channels have distinct biophysical properties compared to the other NaV isoforms1 (A). The IV relationship (B) and conductance (C) of hNaV1.9 currents recorded from 126 Qube 384 multi-hole wells. Voltage dependence of fast and slow Inactivation displayed in D. Recovery from fast and slow inactivation shown in E. Data for inactivation kinetics obtained using QPatch48.
2. Effects of GTPγS on hNaV1.9 on biophysics/pharmacology
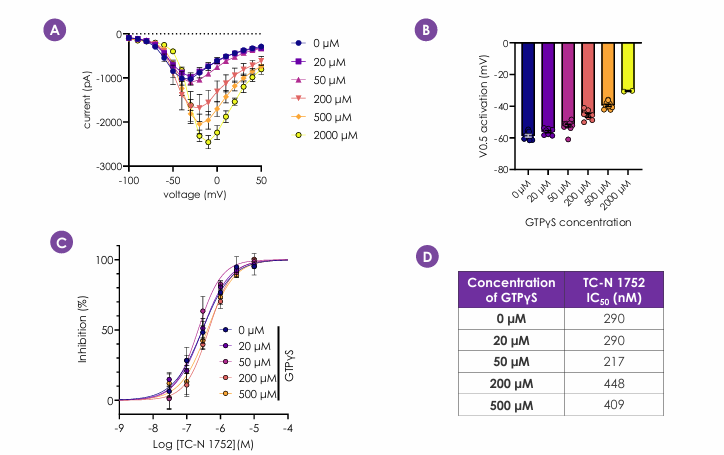
Figure 3 - Enhanced G-protein signalling has been shown to potentiate NaV1.9 current amplitudes6. Addition of up to 500 µM intracellular GTPγS resulted in larger hNaV1.9 currents, with a depolarising shift V0.5 of activation (A,B). Importantly, GTPγS concentration did not alter hNaV1.9 pharmacology (C,D). A concentration of 200µM was used for routine screening.
3.Pharmacological assessment of hNaV1.9 and rNaV1.9 using Qube
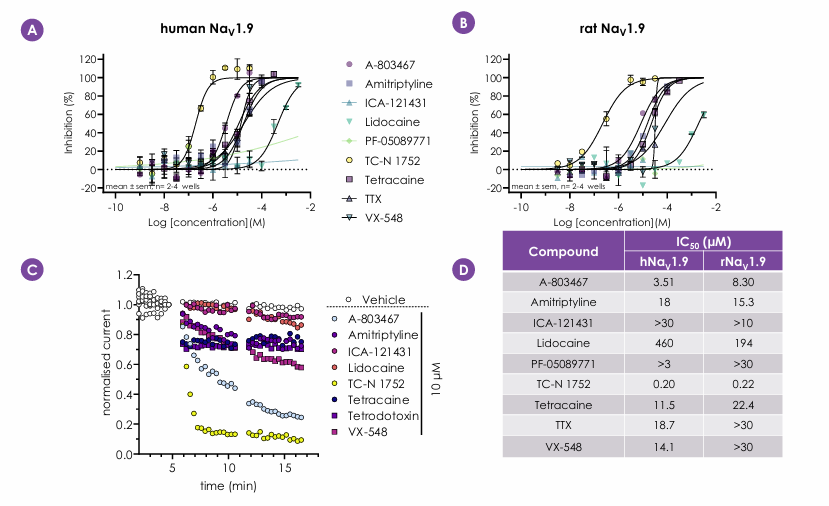
Figure 4 – Validated Qube 384 assays testing a selection of NaV inhibitors with a range of potencies against hNaV1.9 (A) and rNaV1.9 (B). Representative I-t plots of vehicle or compound (at 10 µM) against hNaV1.9 are shown in C. Table with calculated IC50 values (D).
4. Blinded assessment of hNaV1.9 pharmacology using spiked plated approach
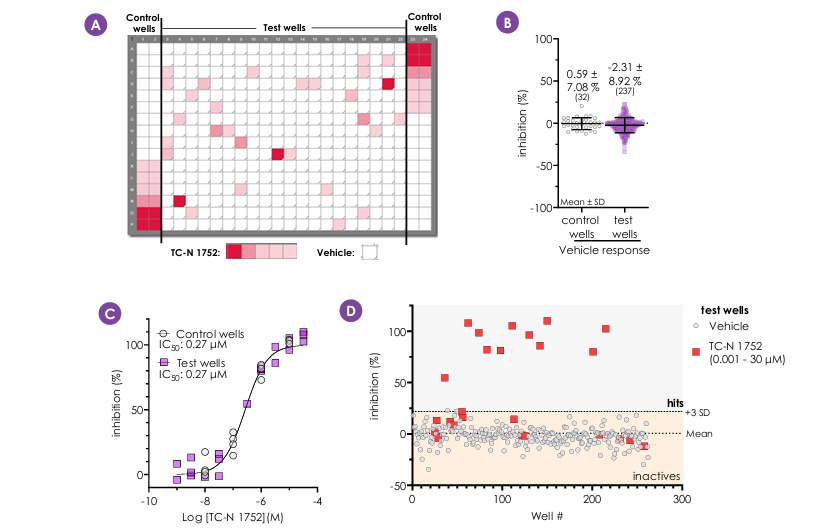
Figure 5 - The robustness of the Qube 384 assay was further validated by assessing the potency of TC-N 1752, using a randomised spiked plate approach (plate map - A). Vehicle response and TC-N 1752 potency correlated well between control and test wells (B, C). In test wells, the vehicle response displayed low variability with the TC-N 1752 response (at >0.1 µM) easily discernible above the mean vehicle response + 3 SD threshold (D).