Nature Communications paper ‘The nucleobase guanine at the 3′-terminus of oligonucleotide RGLS4326 drives off-target AMPAR inhibition and CNS toxicity'
To enable drug discovery teams to deliver high quality pain treatment candidates to the clinic Metrion provides a full suite of specialised preclinical services, including:
Ion channels play an integral role in pain signalling, making them attractive therapeutic targets. Among the most clinically relevant are voltage-gated sodium channels (NaV1.7, NaV1.8, and NaV1.9), TRP channels, such as TRPV1 and TRPA1, K2P channels and acid-sensing ion channels.
Metrion offers extensive experience and technical capabilities in the pain target field to accelerate your hit-to-lead drug discovery programme.
Manual patch clamp assessment is offered for optimal validation of candidate potency. Our manual patch clamp expertise in heterologous cell line and dissociated dorsal root ganglion neuron screening enables comprehensive mechanism-of-action characterisation and translational assessment of your lead compound.
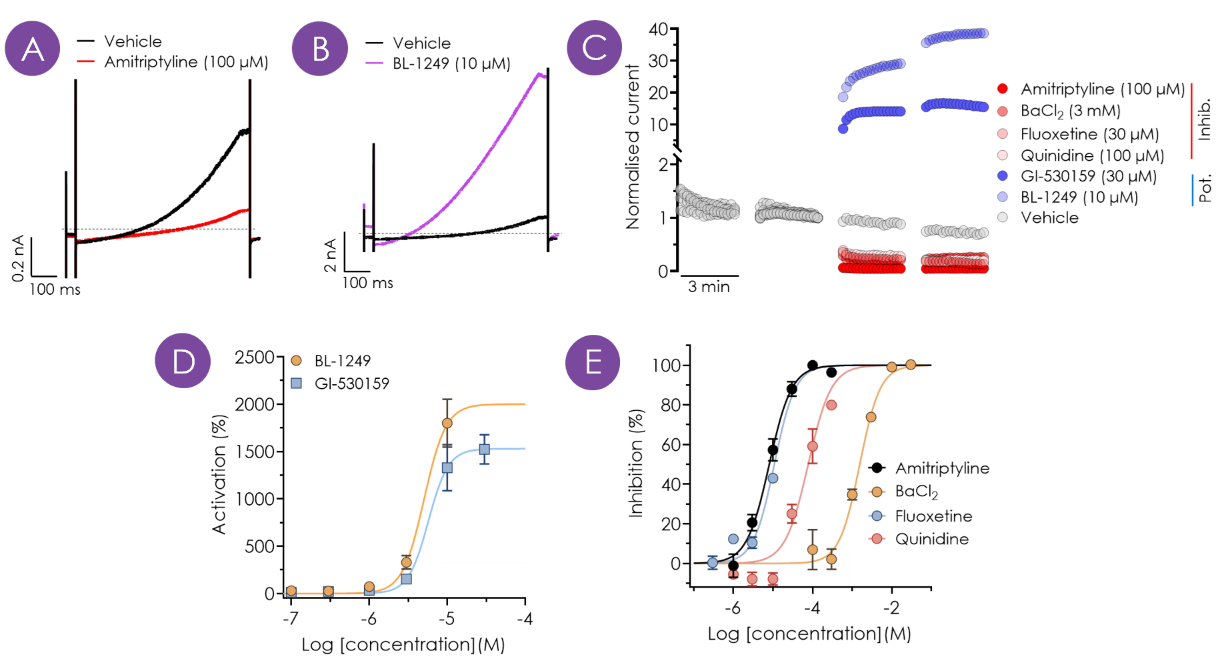
Figure 1. Pharmacological assessment of hTREK-1. (A,B) Representative traces of hTREK-1 current response when exposed to amitriptyline (A, 100 μM) or BL-1249 (B, 10 μM). (C) Representative current-time plots of cells exposed to vehicle (0.3 % v/v DMSO) or inhibitor (‘Inhib.’) or potentiator (‘Pot.’). (D,E) Concentration-response curves for potentiators (D) or inhibitors (E). IC50s (µM): amitriptyline – 8.08, BaCl2 – 1552, fluoxetine – 10.8, quinidine – 77.6. EC50s (µM): BL-1249 – 5.06, GI-530159 – 5.73.
The demand for chronic pain treatment is expanding and NaV1.9 has emerged as a high-value therapeutic target. Drug discovery research on NaV1.9 has long been hampered by difficulties in obtaining heterologous expression suitable for screening.
An extensive NaV1.9 screening cascade has been developed by Metrion, bridging initial high-throughput hit generation of library molecules on our automated patch clamp system to translational characterisation in a native system, of a lead molecule via manual patch clamp.
The cascade starts with a robust hNaV1.9-expressing cell line, generated in-house, capable of reproducible pharmacology and supporting HTS campaigns via automated patch clamp electrophysiology. In addition, we offer a validated rat NaV1.9 expressing cell line for species selectivity screening on our high-throughput automated patch clamp system.
Our rat NaV1.9-expressing cell demonstrates similar current expression and performance to the hNaV1.9 expressing cell line, while sharing comparable pharmacology for standard sodium channel toolkit compounds.
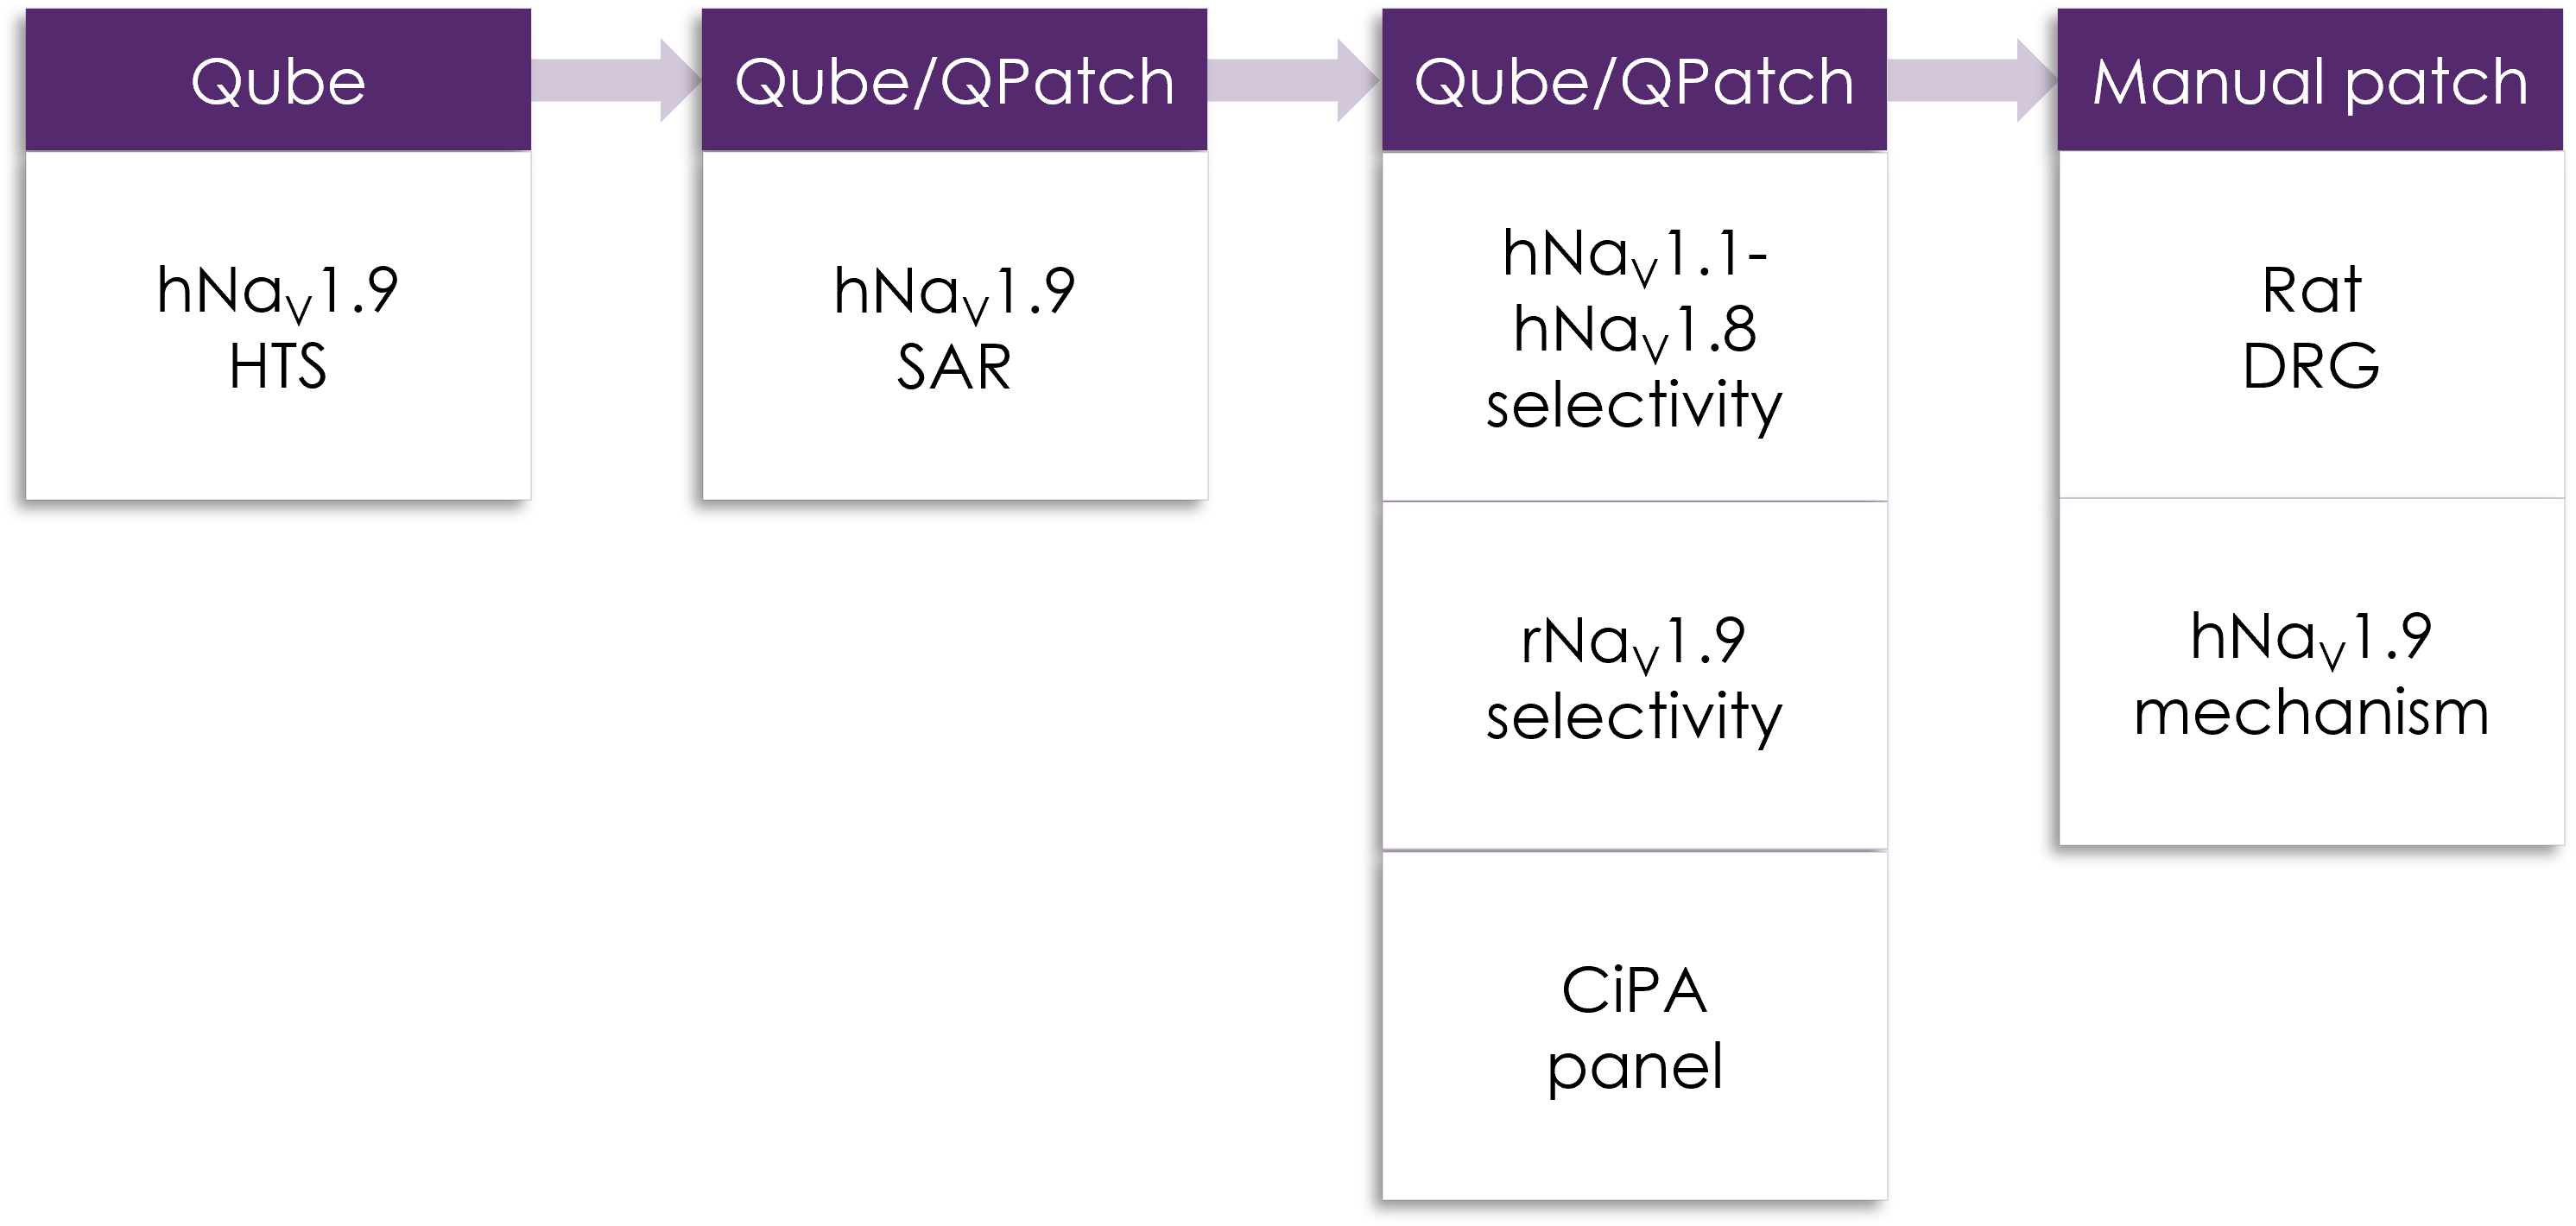
Figure 2. Example of Metrion's NaV1.9 screening cascade.
Metrion’s longstanding expertise in neuroscience has enabled us to develop a manual patch clamp assay to evaluate endogenous NaV1.9 in rodent dorsal root ganglion neurons.
The synergy of high-quality manual patch clamp analysis with NaV1.9 expressed endogenously within a native neuron, provides an opportunity for mechanistic insight and a translational perspective of compound effects on neuronal firing behaviour.
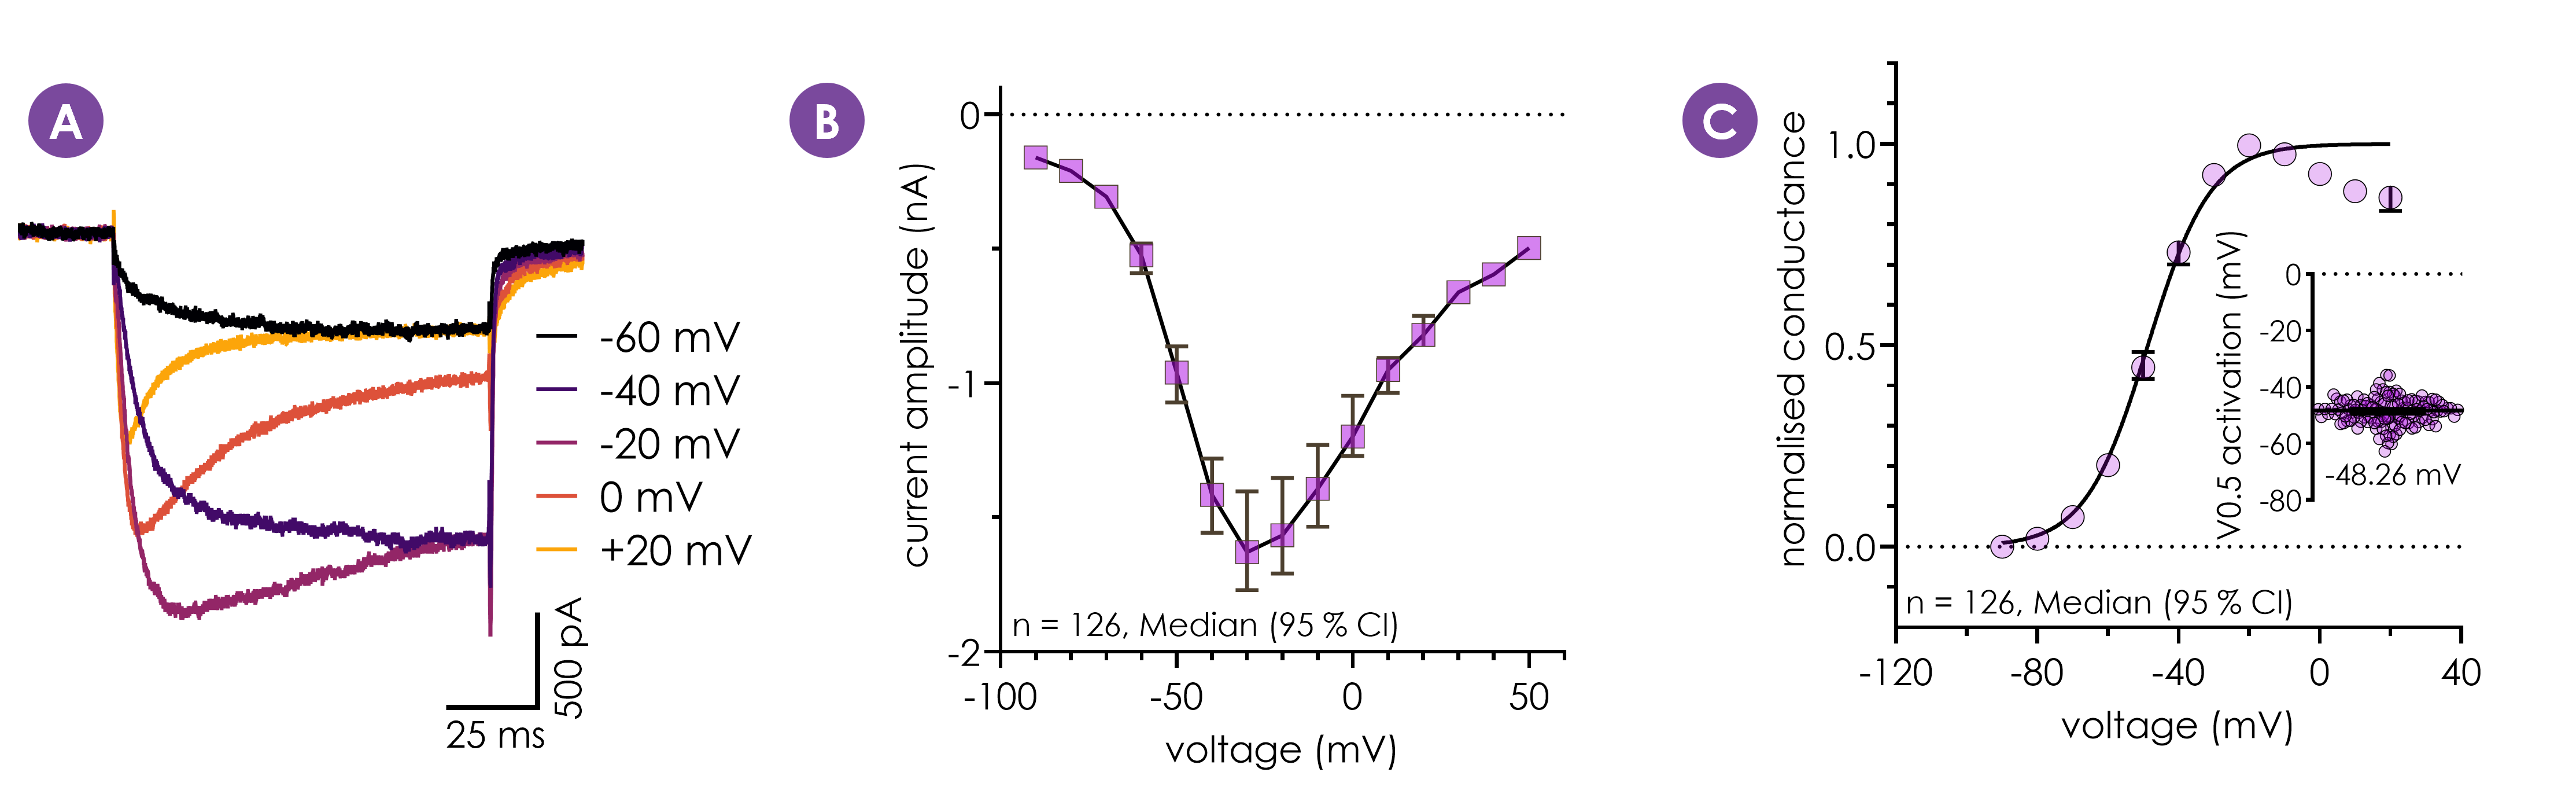
Figure 3. Activation characteristics of hNaV1.9 using automated patch clamp. (A) Representative traces of hNaV1.9 at a selection of voltages. (B,C) IV plot (B) and GV plot (C) of hNaV1.9 activation. V0.5 activation was estimated to be –48 mV.
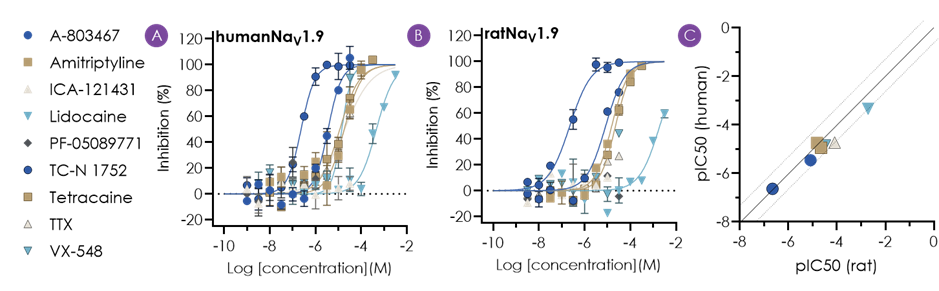
Figure 4. Species comparison of NaV1.9 pharmacology using automated patch clamp electrophysiology. (A,B) A test set of NaV inhibitors were tested against human (A) and rat (B) isoforms of NaV1.9. (C) A comparison of IC50s for the compounds that elicited >50 % inhibition. Solid line represents human pIC50 = rat pIC50, dashed lines represent a 3-fold shift, in both directions, in pIC50.
Validating compounds in translational assays is vital to progressing your drug discovery programme.
A range of translational, phenotypic neuronal assays and platforms are offered by Metrion. These can employ native rodent from the peripheral nervous system or human iPSC-derived sensory neurons. The assays are useful for determining the efficacy, potency and mechanism-of-action of customer compounds designed to treat diseases such as pain and inflammation.
Primarily focusing on functional readouts, we use manual patch (voltage and current clamp) and calcium imaging platforms to record changes in single cell behaviour, and determine the effects of media, cell biology modulators, signalling pathways and test compounds.
These assays often need to be specifically designed for your translational neuroscience and drug discovery needs, please contact us with your requirements.
To compliment your primary compound screening program Metrion offers a broad range of electrophysiological and translational safety assays across a selection of platforms for early cardiac derisking. These assays help overcome the major hurdle cardiac liability poses for drug discovery programme.
Cardiac ion channel screening has been fundamental to Metrion’s success. We are ambitious in our offering and are always looking to expand our capabilities.
Manual or automated patch clamp can be used for efficient screening of hERG, as well as the wider CiPA panel of cardiac ion channels (CaV1.2, NaV1.5, KVLQT1, KV4.3, Kir2.1, KV1.5, HCN4).
Our MHRA-accredited GLP hERG testing service is further offered as part of the manual patch clamp service, providing you with the highest quality, FDA-compliant hERG screening for your IND filing.
For a translational output, we offer high value, clinically relevant, hiPSC-cardiomyocyte assays via manual patch clamp, for investigation of acute compound effect, and a 96-well plate-based fluorescence assay, for chronic investigation on cardiomyocyte toxicity.
Nature Communications paper ‘The nucleobase guanine at the 3′-terminus of oligonucleotide RGLS4326 drives off-target AMPAR inhibition and CNS toxicity'
The presence of sensory neuron markers, excitability properties consistent with sensory neurons, and evidence of nociceptor ion channels (using both RNASeq and electrophysiology) provides strong evidence that iCell Sensory Neurons have a robust sensory neuron phenotype suitable for supporting pain discovery programs.