Improve efficiency, reduce late-stage failures, and align with regulatory standards by assessing the proarrhythmic liability of your compounds early.
With a hit rate of ~30% observed across the industry (Brennan et al. 2024) hERG channels have a high off-target hit rate that has a well-documented link to life-threatening cardiac arrythmias including Torsade de Pointes. Therefore, screening of novel compounds is essential to eliminate this liability early, before lead development, where it becomes more challenging to address.

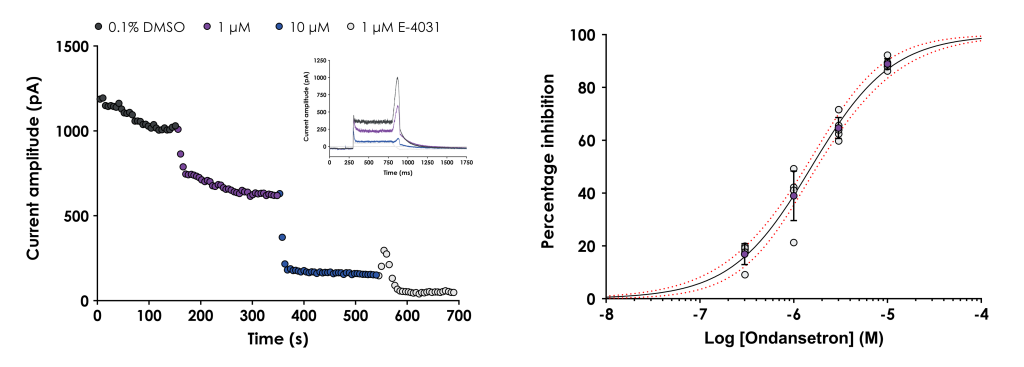
Figure 1.
A. Graph showing the peak hERG tail current (recorded at 37 °C) plotted against time for a representative cell treated with 1 and 10 μM ondansetron followed by 1 μM E-4031. The inset figure shows representative current traces in 0.1% DMSO, ondansetron and E-4031.
B. Graph showing the mean ± SD inhibition data (purple symbols), as well as individual inhibition values (grey symbols), plotted against concentration. The data were fitted with a Hill equation to yield the half-maximal inhibition concentration (IC50) and the 95% confidence bands (red dashed lines).
Early profiling does not require GLP hERG testing, however, it is crucial to follow optimal protocols to ensure accurate assessment of the half-maximal inhibitory concentration (IC50) of a compound against hERG. This includes using the optimal profiling platform to ensure accurate, high-quality assessment of potency, while maintaining ample throughput, turnaround time and cost effectiveness.
This early screening supports efficient resource allocation and informed decision-making, ultimately contributing to the successful development of safer drugs.
Non-GLP hERG screening helps identify potential cardiac liabilities of compounds early in the drug development process. This early identification allows for the elimination of problematic compounds before significant resources are invested in their development.
Conducting hERG screening in a non-GLP environment is less expensive than GLP-compliant studies. Early-stage, cost-effective screening helps manage budgets more effectively, especially when dealing with a large number of compounds.
Non-GLP screening can be conducted more quickly than GLP studies. This rapid turnaround time is crucial for early-stage decision-making and helps accelerate the drug development process.
Non-GLP screening often utilize automated patch clamp systems, allowing for higher throughput screening. This efficiency is more cost effective and enables the assessment of many compounds in a short period. This strategy is particularly beneficial during the early discovery phase when numerous candidates are being evaluated.
By identifying hERG liabilities early, researchers can modify lead compounds to mitigate these risks. This iterative process of optimisation via medicinal chemistry efforts can be done more quickly and efficiently in a non-GLP setting.
Early non-GLP hERG screening data informs strategic decisions about which compounds to advance to more costly and time-consuming GLP studies. This strategic filtering ensures that only the most promising candidates proceed further.
Improve efficiency, reduce late-stage failures, and align with regulatory standards by assessing the proarrhythmic liability of your compounds early.
"The data is always correct and is in a format that imports directly into our systems, making it so quick and easy for our team to review the data across individual projects."